The Calculator app in Windows 10 contains a great list of modes that you can use for a variety of different things. From the hamburger menu in the upper left corner, you can access various calculator and converter modes for things like volume, length, and date calculation. In Windows 10 Insider Preview Build 19546, Microsoft added another mode to that list: graphing.
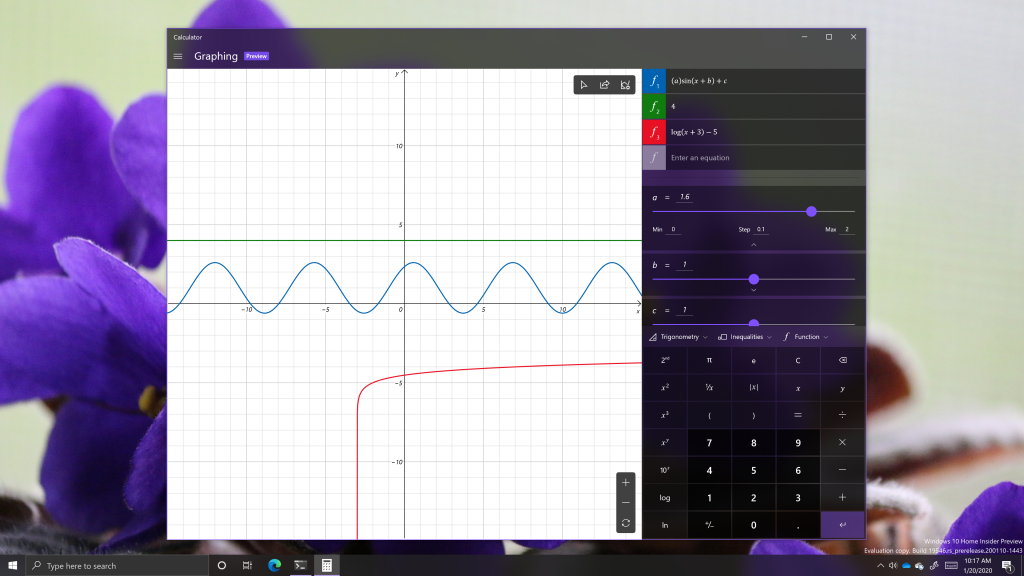
Graphing is currently in preview, so the feature set may change by the time it reaches a broader release. The interface contains a graphing window on the left and an input panel on the right.
You can enter multiple equations into the input area, and the app will graph them in real-time. The color of each graphed equation can also be changed. For equations with multiple variables, additional options will appear below the equation list, which allows you to manipulate the value of those variables with real-time updates from the graphing window on the left.
A trace button in the graphing area will let you view specific points on the lines in the graphing area. Additionally, an ‘analyze’ mode will display the graph’s key features, such as the domain, range, and intercepts (if applicable).
Not all features you would expect to find in a graphing app (such as Desmos) are present in the graphing mode in the Windows Calculator. You can’t plot points, and certain equations cannot be analyzed. Nonetheless, the graphing mode is a welcome addition to the Windows Calculator that most users will find adequate for basic graphing.