Power BI Desktop gets new Q&A feature and interactive element buttons
![]() 2 min. read
2 min. read
![]() Published on
Published on
Share this article

Read our disclosure page to find out how can you help Windows Report sustain the editorial team Read more
Seems as though Microsoft has been putting more umph! behind its data visualization solution, Power BI, relatively speaking. Over the past two years, those of us who have only been tangentially paying attention to the developments of Power BI have seen the team deliver feature updates as regularly as Windows 10 been pushing Insider builds.
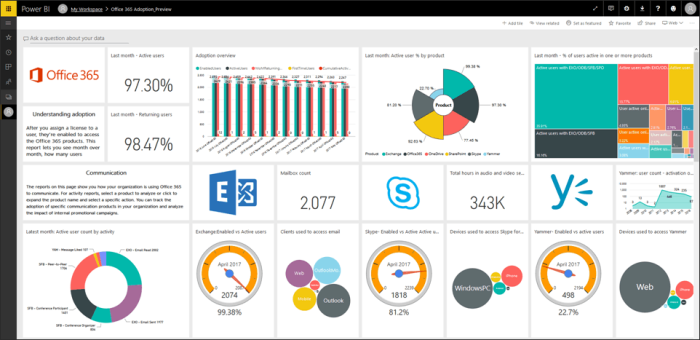
The monthly updates fall in line with Microsoft’s approach to evolving most of its products into platforms for services and this month’s batch of features brings customers Q&A Explorer.
Q&A Explorer is yet another way for customers to view and arrange datasets within Power BI by allowing the assigned users to ask questions about the displayed data and enabling additional interactive elements to reports.
Furthermore, owners of the docs can assign dialog to an image, shape or button by using Q&A Explorer in its current preview form that can then be interacted with by the assigned user/viewer.
While you are in edit mode, you can also add suggested questions. Any suggested questions you add will be available in the dialog for consumers to view. To add suggested questions, just type in the question you have and click the add button. This will add the question to the left suggested questions pane. If you decide later you want to remove a question, just click the “X” next to the question you want to remove.
The new Q&A Explorer feature is just the tip of the iceberg for updates coming down the pike for customers in the month of April. Other features and fixes for this month include:
Reporting
- Q&A Explorer (preview)
- Buttons to trigger actions
- Combo chart line styles
- Improved default sort for visuals
- Numeric Slicer now generally available
Analytics
- Update your linguistic schema
- New DAX function: COMBINEVALUES()
Custom visuals
- Organizational visuals now generally available
- Overview by CloudScope
- Icon Map by Altius
- Hexbin Scatterplot
Data connectivity
- Adobe Analytics connector now generally available
- SAP HANA connector improvement: Port selection
- Dynamics 365 Business Central connector
For anyone interested in more details about each new updated setting or additional feature for April, visit the Microsoft Power BI blog, or get your hands on them now by downloading the Power BI desktop tool here.