Microsoft explains how Bing maps helped with COVID-19 vaccines in the U.S.
2 min. read
Published on
Read our disclosure page to find out how can you help Windows Report sustain the editorial team Read more

Ever since COVID-19, there has been an influx of information, specifically about the shipment of vaccines and their availability. As such, Microsoft used this premise to come up with a platform where people could easily access credible information in one convenient location.
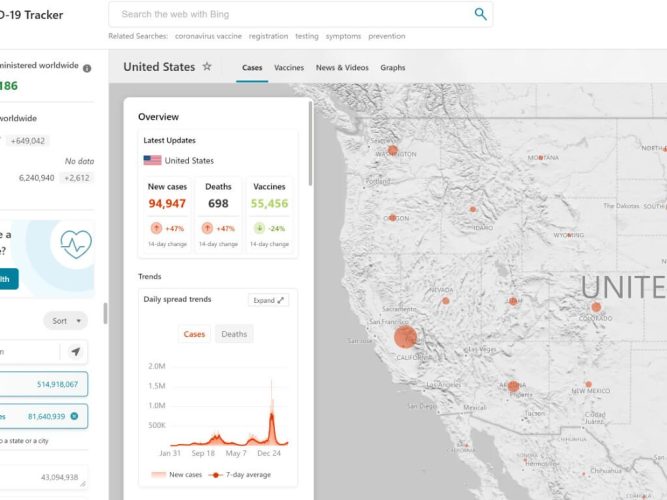
This is where Microsoft capitalized on the Bing Maps platform. They used it to create a “one-stop website” where individuals could easily get precise visualized information in regards to worldwide cases, vaccine distribution plans, and vaccination deliveries.
According to the blog post by Microsoft:
To tackle the challenge, Microsoft Bing leveraged the versatility of the Bing Maps Web control to power the Bing Maps COVID-19 Tracker. This comprehensive tracker was built around the philosophy of promoting action by democratizing information through sharing of the Bing Maps COVID Tracker Data set.
The COVID-19 tracker has provided insight on the virus’s case distribution and vaccination plans of multiple countries at a glance. The data provided here is sourced from credible entities such as the CDC and WHO. The tracker also relies on Location Intelligence resources like Location Recognition API and Spatial Data Service Geodata API to incorporate vital features. Bing Maps is effective and efficient, hence its extensive use when providing aggregated COVID-19 and vaccination information.
Bing Maps uses AnimatedTileLayer events to enhance the visualization of vaccine availability and the current predicament of each state. AnimatedTileLayer helps developers come up with map tiles that are updated at predetermined intervals. The tracker is integrated with Power BI and Excel which are helpful especially when it comes to the automation of data visualization and presenting real-time graphs for any region.
These facilities are still available for use and have proven to be quite effective when it comes to providing reliable information about the distribution of vaccines and has also helped people isolate in regions with a high infection rate.


