How to use insights in Microsoft Teams to analyse how your team communicates
![]() 2 min. read
2 min. read
![]() Published on
Published on
Share this article

Improve this guide
Read our disclosure page to find out how can you help Windows Report sustain the editorial team Read more
Microsoft Teams has grown into a mature corporate chat system which helps you to communicate and stay connected with colleagues. Making Teams your central communications hub gives the tool unique visibility into your daily interactions. This data is exposed as team-level analytics within the app’s interface.
Anyone can view the analytics associated with teams which they’re a member of. A high-level overview of all teams is available by clicking the Settings icon next to the “Join or create a team” button. Next, switch to the Analytics tab of the “Manage teams” screen.
Here, you’ll see a list of all of your teams. Use the dropdown box in the top-left to select the date range for the analytics. There’s currently only two options – last 7 days, or last 28 days.
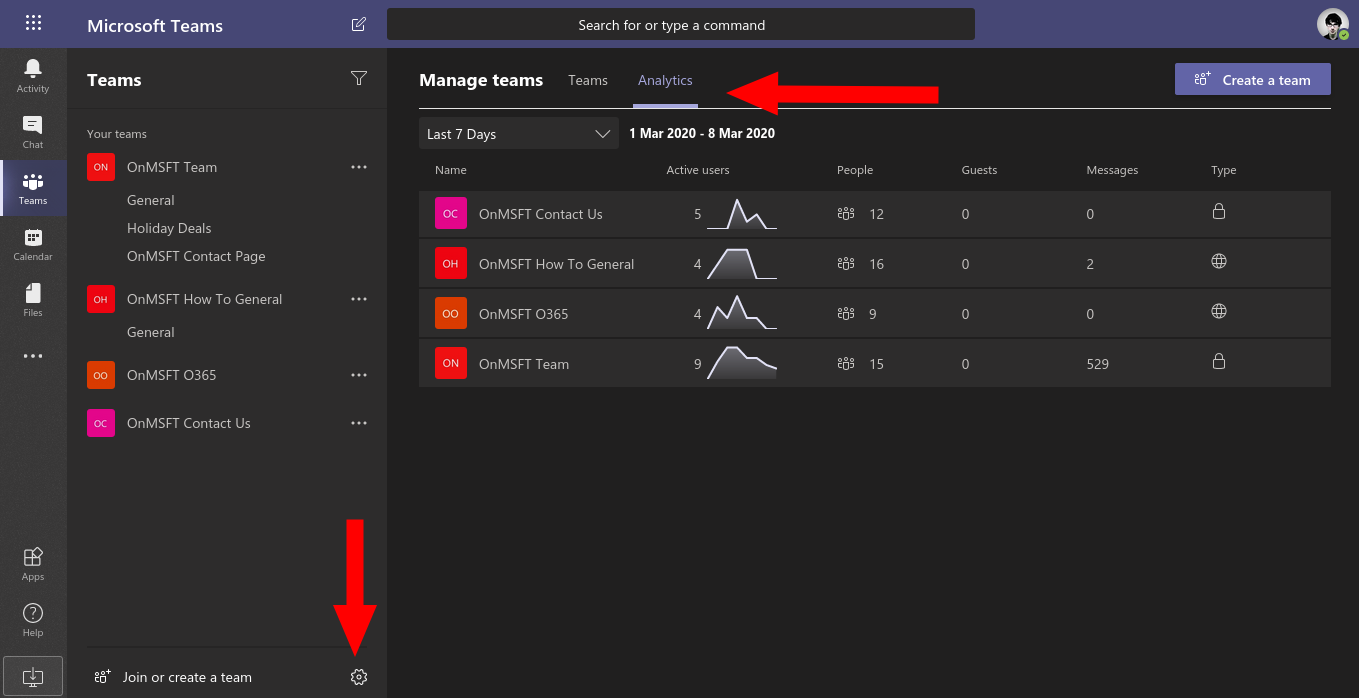
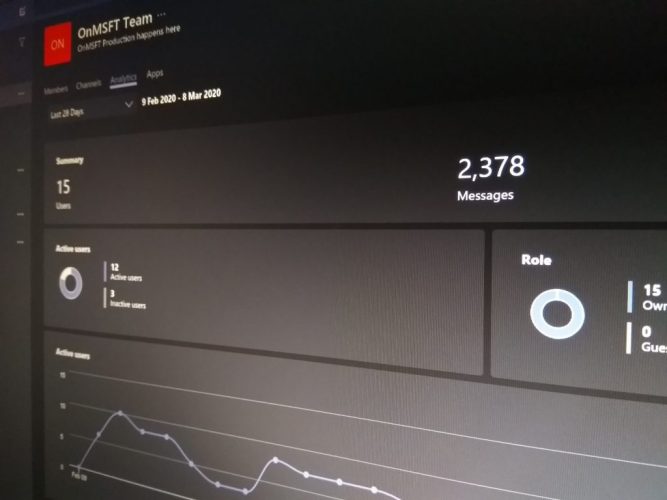
The analytics displays a count of the messages sent to the team within the selected timeframe. You also get a histogram indicating how the number of active users varied during the period. An “active user” is any team member who posted a message into the thread or performed an intentional action within a Teams client.
You can get more detailed information about a team’s activity by clicking its name. This will take you straight to the team-level analytics page. This can also be accessed by clicking the “…” button next to a team in the sidebar. Select “Manage team” from the dropdown menu, then the Analytics tab at the top of the page.
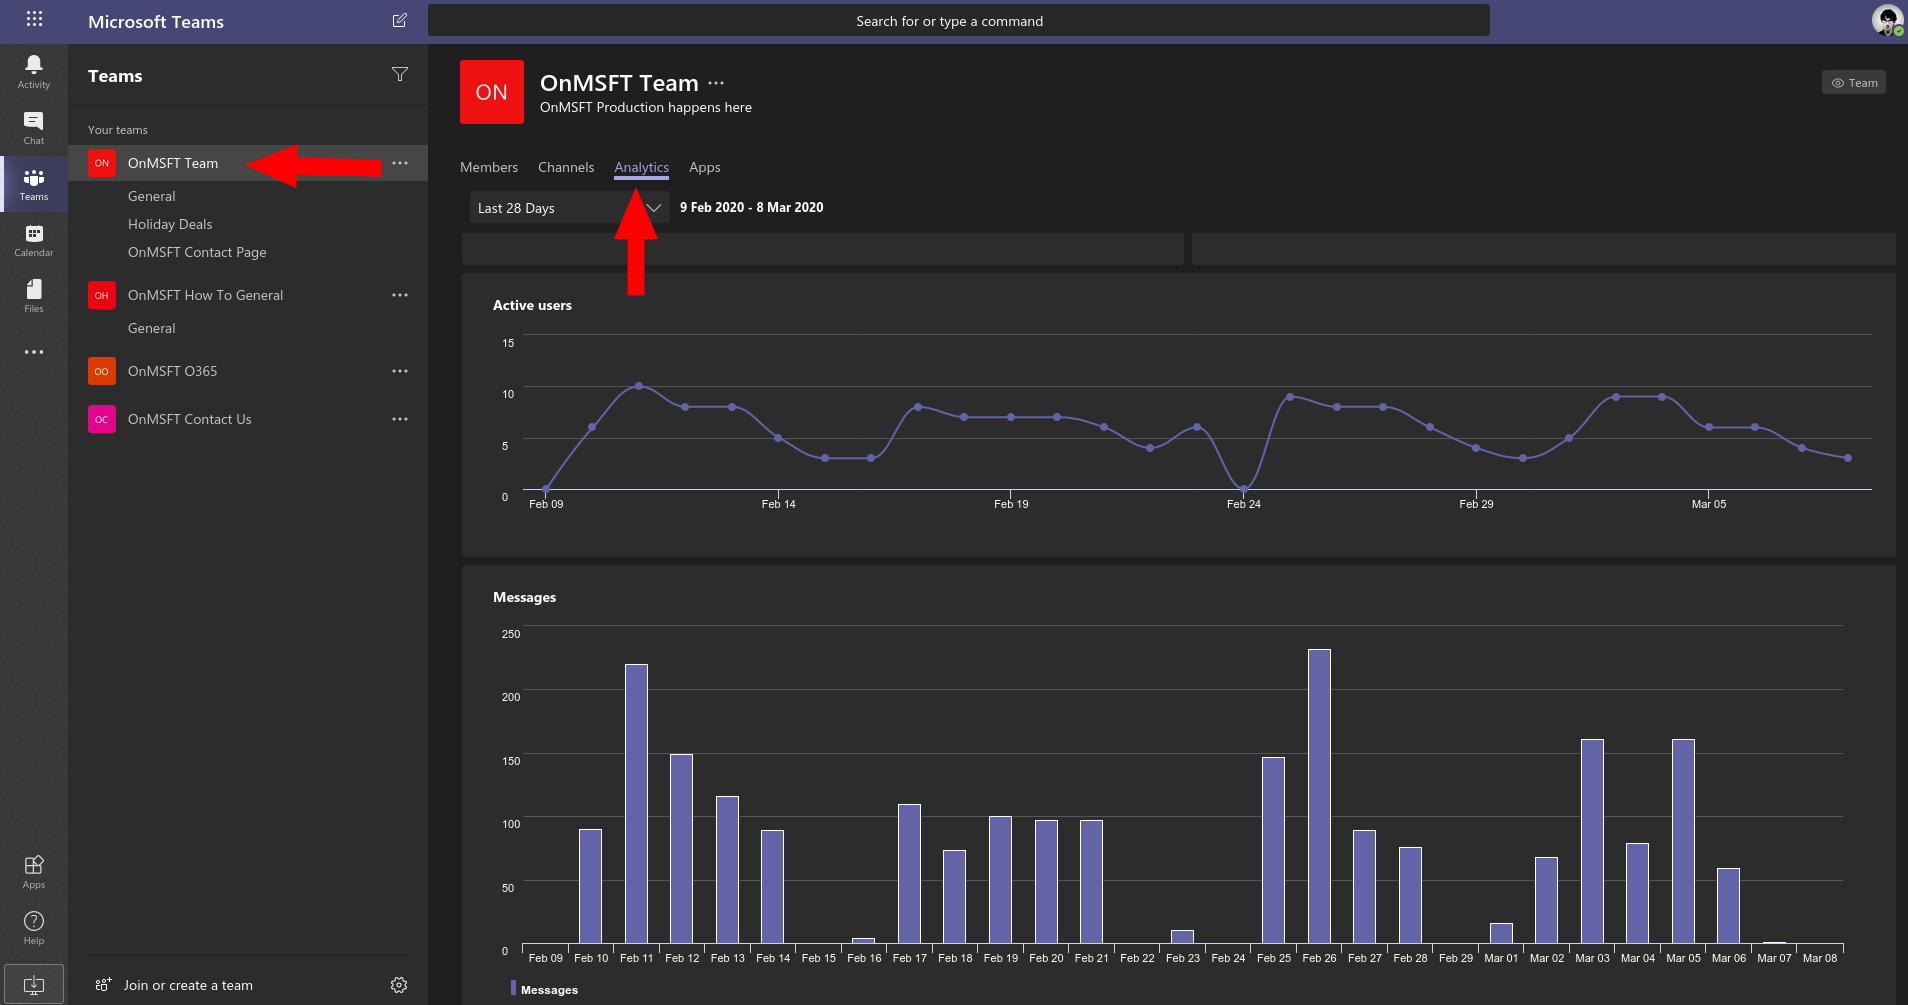
The team-level analytics give you a much more detailed view into messaging patterns. The active users and sent messages metrics are graphed day-by-day, so you can easily see when your team’s communications reached a peak. Hovering over a point on the graph reveals the count for that day.
The data is supposed to give you a starting point when assessing the usage patterns and work habits of your team. Using the insights you obtain, you may be able to identify working trends which help you to improve the performance of your team.
As an example, a very busy team with lots of messages between members might indicate an imbalance in the distribution of information. A more more focused team may be quieter, if people are having to spend less time exchanging knowledge in chat threads. By providing these metrics, Teams gives you more options when planning for productivity and optimising knowledge distribution.